Market Intelligence Brief: Yesterday’s Rally Reversed, the Nasdaq Breaks 24,000, and the DAX Enters Uncharted Territory
March 26, 2026 - Mixed messaging from the US and Iran has erased the gains from Wednesday’s peace plan. The Nasdaq has broken below 24,000, with the next major support at 23,000. The DAX has broken its long-term range with no clear floor until 21,500. Both the SPX and Nasdaq have now wiped out their late-2025 gains entirely.
The pattern the market has established over four weeks of conflict has reasserted itself. Wednesday’s coordinated rally in support of the 15-point peace plan and Trump’s characterisation of Iranian enthusiasm have been undermined by Thursday’s mixed messaging between Washington and Tehran. US futures edged lower throughout the night. The Nasdaq has broken below its support level around 24,000, making lower lows and lower highs. The SPX and Nasdaq have now both erased the gains accumulated in the latter part of 2025, bringing the indices back to levels not seen since mid-year. In Europe, the DAX has broken below 23,400, ending its long-term range and leaving no clear support until 21,500. The FTSE has formed a double top at 10,100, and its own uptrend since the conflict began has ended. Thursday is the session in which the accumulated weight of four weeks of signal-and-reversal cycles arrives at a genuinely significant structural marker.
The Reversal Pattern Completes Again
Wednesday’s rally was the most convincing positive session of the conflict period. The inputs supporting it, a US President characterising Iranian intent in specific terms and a reported 15-point peace plan, were more substantive than any previous positive signal. The market responded accordingly, with the Nasdaq up over 1% and Germany 40 gaining 1.68%. The observation at the session’s close was that confirmation, rather than additional signals, would determine whether the recovery was sustained.
Confirmation has not arrived. What has arrived instead is the mixed messaging that now characterises every cycle of the pattern: a positive signal from the US side meets a contradictory or ambiguous response from the Iranian side, confidence reduces, and the recovery gives way to renewed selling. The speed with which Wednesday’s gains have been reversed underscores both the market’s sensitivity to these signals in either direction and the fragility of recoveries built on unconfirmed diplomatic developments.
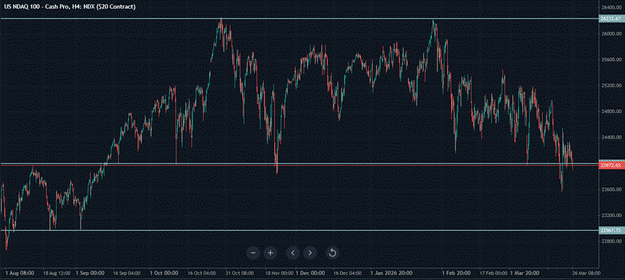
The reversal is not merely a retracing of Wednesday’s gains. The Nasdaq’s break below 24,000 marks a structural deterioration that puts the index in a new phase of its conflict-period trajectory. The support at 24,000 had been identified as a meaningful reference point. It’s a break, accompanied by the pattern of lower lows and lower highs that is the technical definition of a downtrend, removes the framework that had been providing structure to the Nasdaq’s decline and opens a longer path toward the 23,000 level, where the market found its footing in August and September of last year.
The Nasdaq’s Late-2025 Gains: Fully Erased
The observation that both the S&P 500 and the Nasdaq have wiped out their gains from late 2025 is the most significant contextual marker of the conflict’s cumulative market impact. The late-2025 period represented the culmination of a powerful advance driven by AI infrastructure investment, earnings growth, and sustained investor confidence. The conflict has now reversed the entirety of that advance in both indices, placing them back at levels where the current bull market was in its mid-phase rather than at its peak.
The significance is not only backwards-looking. Late-2025 price levels were the levels at which the market traded before the AI earnings cycle began to deliver its most powerful results and before the investment case for AI infrastructure was fully reflected in valuations. Returning to those prices does not mean the investment case has been destroyed; it means the conflict has erased the valuation premium that was applied on top of the already-strong fundamental case. Whether that premium can be rebuilt depends on whether the conflict concludes and whether the AI infrastructure story retains its momentum through the disruption.
For investors who entered positions during the late-2025 advance, the return to those levels erases gains held for several months. The psychological and practical implications of that for positioning decisions, for the willingness to add to positions at current levels, and for the behaviour of participants who defined their cost basis in late 2025 will influence how the index behaves around these levels in the sessions ahead.
The DAX Breaks Its Long-Term Range: A Structurally Significant Development
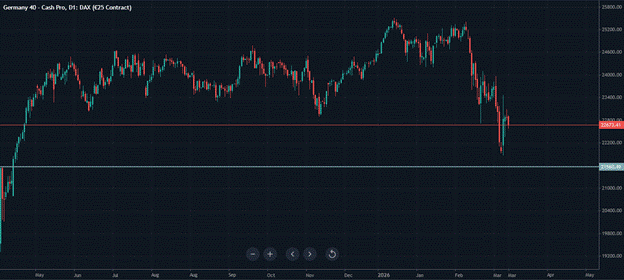
Germany 40 is down 1.13% on Thursday morning, but the percentage decline understates the structural significance of the session’s development. The DAX has broken below 23,400, a level that defined the lower boundary of its long-term range. The commentary’s assessment is direct: there is now no clear support level until 21,500.
The distance from the current level to 21,500 is considerable. A break below a long-term range support into territory with no established support structure is among the more challenging technical situations an index can find itself in. Without reference points that have historically attracted buyers, the process of finding the next equilibrium involves price discovery rather than structured support. Price discovery means the index must fall to a level where buyers emerge organically rather than in response to a known support level, and that level is not identifiable in advance from the chart.
Germany’s specific vulnerabilities compound the technical picture. The energy intensity of German industry, the LNG supply chain exposure, the ECB’s tightening bias, and the extended conflict timeline are all structural headwinds that have accumulated over the conflict period without being addressed. Into the period with no clear support, those headwinds provide no natural floor, and the next identifiable reference point at 21,500 is derived from historical market behaviour rather than current fundamental valuation.
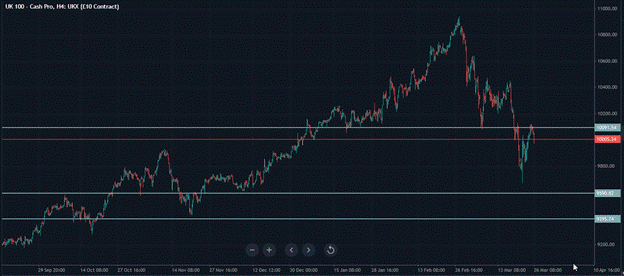
The FTSE’s Double Top and Uptrend Ending
The FTSE UK 100 is down 0.81% and has formed a double top at the 10,100 level, which coincides with the March 9 low. The double top is a technically significant formation: two attempts to push through a resistance level, both failing, leave a pattern that suggests the selling pressure at that level is stronger than the buying interest trying to break through it. The coincidence of the double top with the March 9 low adds weight to the level’s significance as a structural ceiling.
The ending of the FTSE’s uptrend since the conflict began is a meaningful change in the index’s character. For most of the conflict period, the FTSE maintained a constructive underlying structure, supported by its energy sector natural hedge and the upward channel that had defined its trajectory. A double top formation and a broken uptrend have now replaced that channel. If US weakness continues to drag European markets lower, the FTSE’s next identified support level sits at 9,590, a meaningful distance from the current price.
The FTSE breaking below 10,000 intraday, with the round number carrying both technical and psychological significance, is the visible expression of the index’s structural deterioration. The energy sector’s natural hedge, which provided a cushion during earlier phases of the conflict, is less effective as a support mechanism when the broader market shifts from range-bound to a confirmed downward trajectory.
US Futures and the Structural Context
The S&P 500 is down 0.73%, and the Nasdaq 100 is lower by 0.84%, both extending their pattern of lower lows and lower highs. The Dow is off 0.68%. The uniform direction across all three major US indices reflects a broad-based reassessment of risk rather than sector-specific or rotation-driven selling.
The Nasdaq’s break below 24,000 is the session’s most significant US market development. The level had been holding as a reference point through several sessions of pressure. It’s a break, with the lower lows and lower highs pattern now firmly established, that defines the Nasdaq’s current trajectory as a downtrend rather than a range. The next major support at 23,000 is derived from the August-September period of last year, when the market bounced from those levels multiple times. Whether that historical support proves relevant in the current context depends on whether the conditions that made it support in August and September, principally the absence of a major geopolitical conflict and its associated economic consequences, are remotely similar to Thursday’s environment.
The broader context bears restating: both the SPX and the Nasdaq have now erased their late-2025 gains. The conflict has achieved, in just under four weeks of active market impact, the complete reversal of several months of advance built on the strongest phase of AI-driven investment optimism. The fundamental underpinnings of that advance have not been destroyed, but the geopolitical overlay has fully overshadowed them.
Initial Jobless Claims: The Day’s Scheduled Data
Initial Jobless Claims for the week ended March 21 are due at 12:30, with a forecast of 216,000 against the previous reading of 205,000. The forecast increase, if confirmed, would represent a modest but directionally notable rise in the weekly claims figure. In a normal market environment, a 216,000 claims reading would be assessed as broadly consistent with a healthy labour market and unlikely to generate significant market movement.
In the current environment, the claims data carries a different relevance. If the conflict’s economic impact is beginning to affect employment conditions, a rising claims trend would provide the first hard labour market evidence of that impact. The 205,000 to 216,000 move, if confirmed, is not dramatic enough to signal a fundamental deterioration, but it sits in a context where the direction of the trend matters as much as the level. A series of incrementally rising claims in the weeks ahead would be more market-relevant than any single reading.
The data will be processed in a session where geopolitical developments continue to dominate. No major earnings are scheduled today, leaving the conflict’s latest mixed messaging, the technical breaks across major indices, and the claims data as the three inputs available to a market that has now received confirmation of a direction it had been waiting for: negative.
The Bottom Line
Thursday opens with the complete reversal of Wednesday’s peace plan rally, the Nasdaq breaking below 24,000, the DAX breaking its long-term range into territory with no clear support until 21,500, and the FTSE forming a double top and ending its uptrend since the conflict began. Both the SPX and Nasdaq have now erased the entirety of their late-2025 gains.
The mixed messaging between the US and Iran that drove the overnight decline has reasserted the pattern that has characterised the conflict period from the beginning: positive signals are generated, partially priced, and then contradicted before they can be confirmed. Each cycle of the pattern has left markets lower than before, and Thursday’s technical breaks are the cumulative expression of four weeks of that process.
Initial Jobless Claims provide the session’s only scheduled data point and will be assessed for early evidence of employment-level impact from the conflict’s economic disruption. No major earnings provide any counter narrative. The direction of travel is clear in the charts. What is not yet clear is where the next stable floor is found, and the answer to that question depends on the diplomatic variable that the charts cannot price in advance.
Lunaro Financial Services Limited (trading as ‘Lunaro’) is an execution-only service provider. This material is a marketing communication and is provided for general information and educational purposes only. It does not take into account your personal circumstances, objectives or needs. Any opinions are those of the author at the time of writing and may change without notice. Nothing in this material constitutes (or should be construed as) financial, investment, legal, regulatory or tax advice, or a recommendation to engage in any investment activity. You should not rely on this material when making investment or trading decisions.
This material has not been prepared in accordance with legal requirements designed to promote the independence of investment research and is not subject to any prohibition on dealing ahead of the dissemination of investment research. Lunaro may deal as principal and/or have an interest in the financial instruments or markets referred to in this material in the ordinary course of its business, including at or around the time of publication, and does not seek to take advantage of this material prior to its dissemination.
While reasonable care has been taken in preparing this material, no representation or warranty is made as to its accuracy or completeness and Lunaro accepts no liability for any loss arising from any use of, or reliance on, this material.
Approximately 80% of retail investor accounts lose money when trading CFDs with this provider. You should consider whether you can afford to take the high risk of losing your money


Comments
Post a Comment